
Does eating red meat cause Type 2 Diabetes?
Yet another article from researchers at Harvard’s TH Chan School of Public Health has recently been published stating that their analyses of their self-created prospective cohorts shows an association between red meat consumption and incidence of type 2 diabetes
Accordingly, a review of the scientific literature, including some commentary on that study, and other published data relating to the topic is timely.
Demographics of Meat Consumption and Diabetes
We begin our review with a look at some interesting demographic data that casts serious doubts on the alleged connection between URM consumption and T2D.
If URM consumption were associated with the occurrence of T2D then demographic data showing the countries that consume the most meat would have the highest prevalence of diabetes, right? And in the USA, the states that consume the highest intake of beef steaks would correlate with prevalence of T2D in those states, would it not?
But demographics tell a very different story.
The five countries having the highest consumption of meat per capita in the world are the United States, Australia, Argentina, New Zealand, and Spain, respectively. Yet the prevalence of diabetes in those countries averages 7.8%, well below the global average of 8.8%. The primary protein source in the country with the highest prevalence of T2D, Pakistan, derives 72% of protein from grains and only 2% from red meat. Conversely, the country that derives the highest percentage of protein from red meat (Argentina at 44%) is ranked near the bottom of the diabetes prevalence list with a ranking of 162nd place.
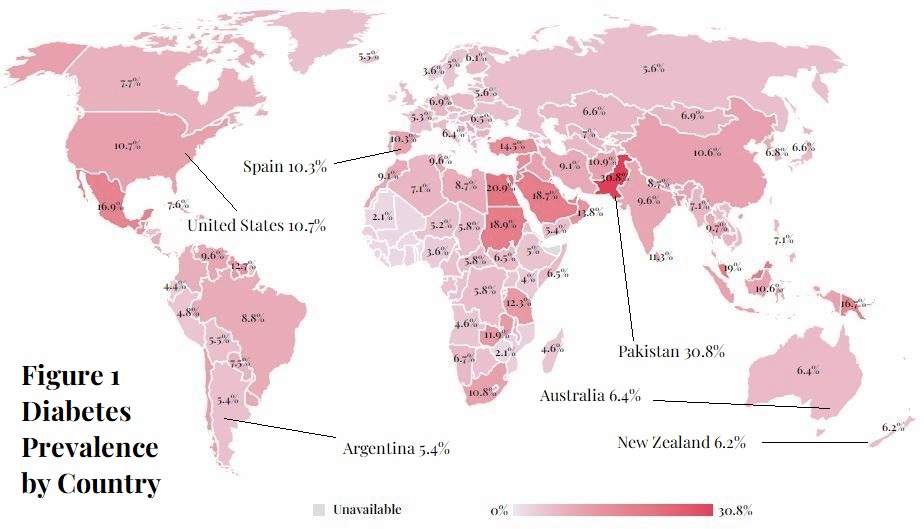
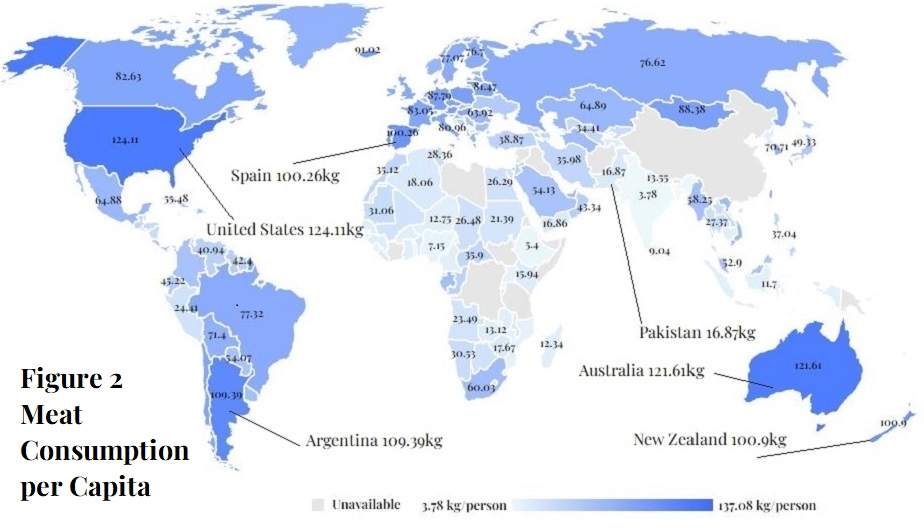
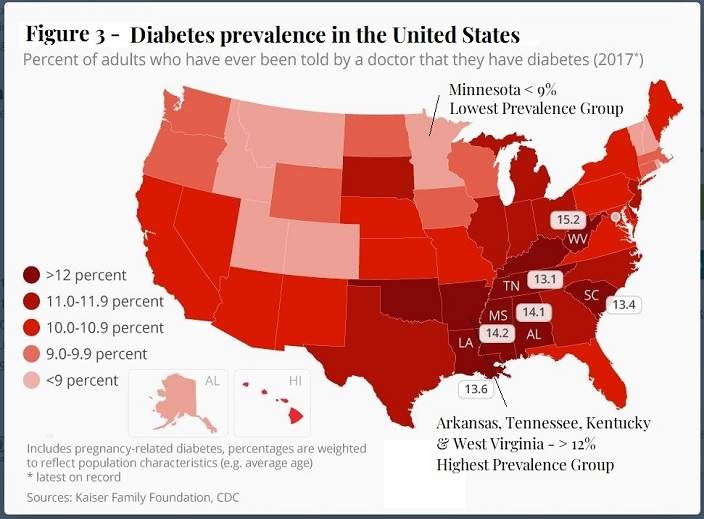
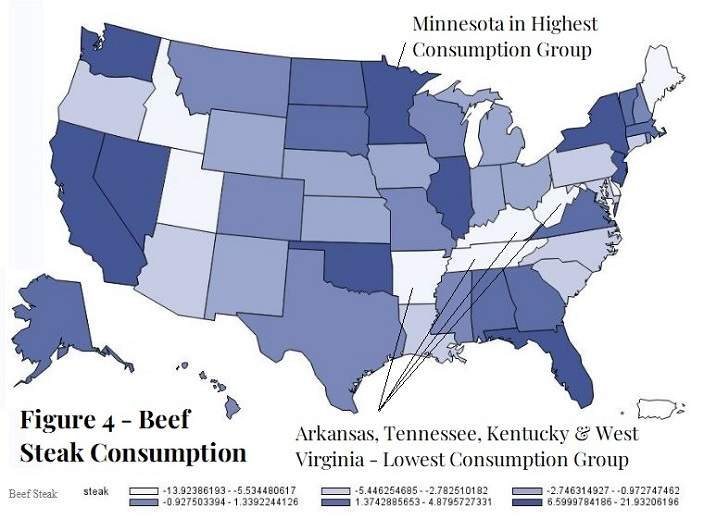
Figure 4 shows the beef steak consumption in the United States by states. The darkest colored states on the map are those with the highest consumption of beef steaks. The white-colored states are those with the least consumption of beef steaks. Figure 3 shows prevalence of diabetes by state. The darkest red states (primarily in the southeast) have the highest incidence of T2D (>12%). The light-pink states have the lowest incidence (<9%).
One of the nine states in the highest category of beef steak consumption, Minnesota, is only one of eight states with diabetes incidence below 9%. West Virginia has the dubious honor of having the highest diabetes rate in the USA at 15.2%. Yet West Virginia was in the group of seven states posting the lowest consumption of beef steaks. Three other states in the highest category of T2D prevalence (Arkansas, Tennessee, and Kentucky) were also in the lowest group of beef steak consumption.
Despite the recurring statements in the scientific literature and the mainstream media that there is accumulating evidence that the consumption of red meat is associated with the risk of type 2 diabetes, on the contrary, the opposite is true.
Observational Studies of Prospective Cohorts
In the past 2 decades the only articles reporting on observational studies of non-ethnic-specific cohorts of at least 5,000 participants that have found a statistically significant association between unprocessed red meat consumption and type 2 diabetes are a litany of articles published by Harvard’s epidemiology college on and an article by The EPIC-InterAct Consortium on a sub-cohort of the EPIC study in Europe.
The EPIC-InterAct Cohort – Red Meat and Type 2 Diabetes
In a 2013 study, The EPIC-InterAct Consortium an association found a statistically significant association between unprocessed red meat consumption and incidence of type 2 diabetes when comparing the lowest versus the highest quantiles of consumption. But the core association in the EPIC sub-cohort study is brought into question by the results of the sensitivity analysis that found that weight (BMI) was likely the mediating factor of the association. When that cohort was divided into three weight groups (BMI<25, BMI=>25 and <30, and BMI=>30) the associations between red meat and T2D was no longer statistically significant in any of the three groups. [The EPIC InterAct Consortium 2013]
The Harvard Cohorts
The only other source of articles examining these larger non-ethnic-specific cohorts that have found an association between unprocessed red meat consumption and T2D come from the pro-plant-based diet proponents at Harvard’s epidemiology college on their self-created cohorts, the Nurses’ Health Study, Nurses’ Health Study II, and Health Professionals’ Follow-up Study (“the Harvard cohorts”). This same epidemiology college told us in 2002 and 2003 that in two of these three cohorts there was no association between unprocessed red meat and T2D. Now in 2023, Willett and Hu are telling us that the association that exists. The supposed reason for the reversal in findings was additional data collected over the past decade.
What they claim are methodological advancements are better described as smoke and mirrors. They use an unorthodox method of cumulative averaging for the data fed into their regression model that they admit favors a finding of statistical significance for their anti-red meat hypothesis.
Despite the fact that two decades of legitimate scientific research (including dozens of well-designed randomized controlled trials) have shown that weight and body composition are the single most important mediating factors for type 2 diabetes, the latest Harvard article on the topic fails to use weight or BMI as an independent covariate in their regression models and then omits BMI as a covariate entirely in the secondary analyses displayed in Tables 8 through 14.
But these unorthodox methodological shortcomings pale in comparison to the questionable viability of the cohorts themselves. The food frequency questionnaire at the foundation of these cohorts is just as questionable. All three cohorts used a 4-year periodic questionnaire that required participants to estimate their average weekly intake of various foods over the preceding year. This method of data collection has been shown to grossly misestimate food consumption.
More viable cohorts, such as the NHANES cohort, use a 24-hour recall interview by trained personnel to collect food frequency data, which has been shown to be immensely more accurate. The Harvard cohort creators make claims that they can accurately adjust for the inaccuracies of the data collection with yet another set of statistical formulas which only add another questionable layer of variability to a scientific methodology that’s already abysmally weak.
But the intake quantity and frequency errors in the Harvard cohorts only scratches the surface of the systematic error that plagues all three cohorts.
The Harvard questionnaire wholly fails to account for the nutrient variants within food groups. For example, the USDA database and the tables used for the NHANES questionnaires show 100g of beef ribeye steak with lean and fat has total energy of 289 kcal and fat of 21.64g. Yet the Harvard food frequency questionnaire apparently registers all beef cuts equally at 199.5 kcal and 9.1g of fat per 100g of beef. That’s a variance from the actual intake of 44.9% for energy and 137.8% for fat content per 100g. This means that when covariate regressions are run for energy the amount being utilized does not accurately adjust for the energy consumption for the beef actually consumed. [Harvard Food Nutrient Tables 2022]
These methodology flaws could account for these three cohorts consistently resulting in results contrary to those reported for European and Asian cohorts. [Zhang 2021]
Cohorts showing No Association between URM and T2D
In contrast to the articles reporting on the Harvard cohorts and the EPIC sub-cohort, the cohort-specific studies shown below, reporting on six international multi-ethnic cohorts found no statistically significant association between consumption of unprocessed red meat and type-2 diabetes. We show each study’s hazard, odds, or risk ratio for lowest to highest quantile of URM consumption and corresponding 95% confidence intervals. The studies are shown in order of lowest to highest risk.
There was no statistically significant association between URM consumption and T2D in the fully adjusted model in any of these studies:
Van Dam 2002 – HPFS n=?? RR 1.05 (0.85, 1.30)
Schulze 2003 – NHS II n=?? 1.26 (0.79-2.04)
Mari-Sanchis 2016 – SUN Project, Spain n=18,527 HR 0.92 (0.62, 1.37)
Lajous 2012 – E3N Study, France n=66,118 HR 0.96 (0.88, 1.11)
Villegas 2006 – Shanghai Women’s Health Study, China n=81,170 RR 0.94 (0.71, 1.12)
Ericson 2013 – Malmö Diet and Cancer Study, Sweden n=27,140 HR 1.01 (0.82, 1.25)
van Dam 2002 – Health Professionals Follow-up Study, USA n=42,504 RR 1.05 (0.85, 1.30)
Mannisto 2010 – ATBC Study, Finland n=25,943 RR 1.22 (0.97, 1.53)
The consensus of the articles reporting on the URM – T2D association is that there is no such association.
Known Risk Factors for T2D
The recognized risk factors for type 2 diabetes per the NIH and the CDC are: 1) being overweight or obese, 2) being pre-diabetic, 3) being older, especially >45 years of age, 4) ethnicity or race, 5) family history of diabetes. [CDC T2D risk factors] [NIH T2D risk factors] Pre-diabetes is defined by the American Diabetes Association as having high fasting blood-glucose (100 to 125 mg/dL) or HbA1C of 5.7% to 6.4%. And the definition of type 2 diabetes is, in fact, when either of those two biomarkers are higher than the level indicated for pre-diabetes.
Chronic inflammation is believed to be a causal factor in a host of metabolic diseases, including type-2 diabetes. C-reactive protein (“CRP”), interleukin-6 (“IL-6”), and tumor necrosis factor (“TNF”) are common biomarkers for this type inflammation. For example, researchers in Greece found that study participants diagnosed with type-2 diabetes ”had 57% higher mean levels of C-reactive protein (p < 0.001), 22% higher mean levels of interleukin-6 (p < 0.001) and 60% higher levels of tumor necrosis factor-alpha (p < 0.001) compared to non-diabetic subjects”. [Pitsavos 2007] [Pitsavos Attica study results] Accordingly, if consumption of red meat were a risk factor for T2D, chronic consumption of red meat would cause higher level of these known biomarkers.
Several recently published eating studies have shown that diets higher in red meat actually either lead to lower levels of these biomarkers for T2D or show no difference in these biomarkers compared to diets with less red meat consumption. [Maki 2020] [Magkos 2022] [Clina 2023]
In a 2021 meta-analysis of 20 independent studies examining the impact of consuming a higher amount of red meat, the researchers found no statistically significant association between higher consumption of red meat and HbA1c, C-reactive protein, interleuken-6, or tumor necrosis factor-alpha, four of the most commonly measured biomarkers for oxidative stress and inflammation. [ O*Connor 2021 ]
More recently, a 2023 meta-analysis of 15 randomized of controlled trials that had studied the impact of red meat consumption on seven recognized biomarkers for type-2 diabetes risk, concluded that there was “no significant impact of red meat intake on any of the eight measured biomarkers that are known to be associated with higher risk of type-2 diabetes.” That meta-analysis, in fact, found a statistically significant reduction in postprandial glucose (SMD: −0.44; 95% CI: −0.67, −0.22; P < 0.001) in diets higher in red meat consumption compared to meals with reduced or no red meat intake. [Sanders 2023]